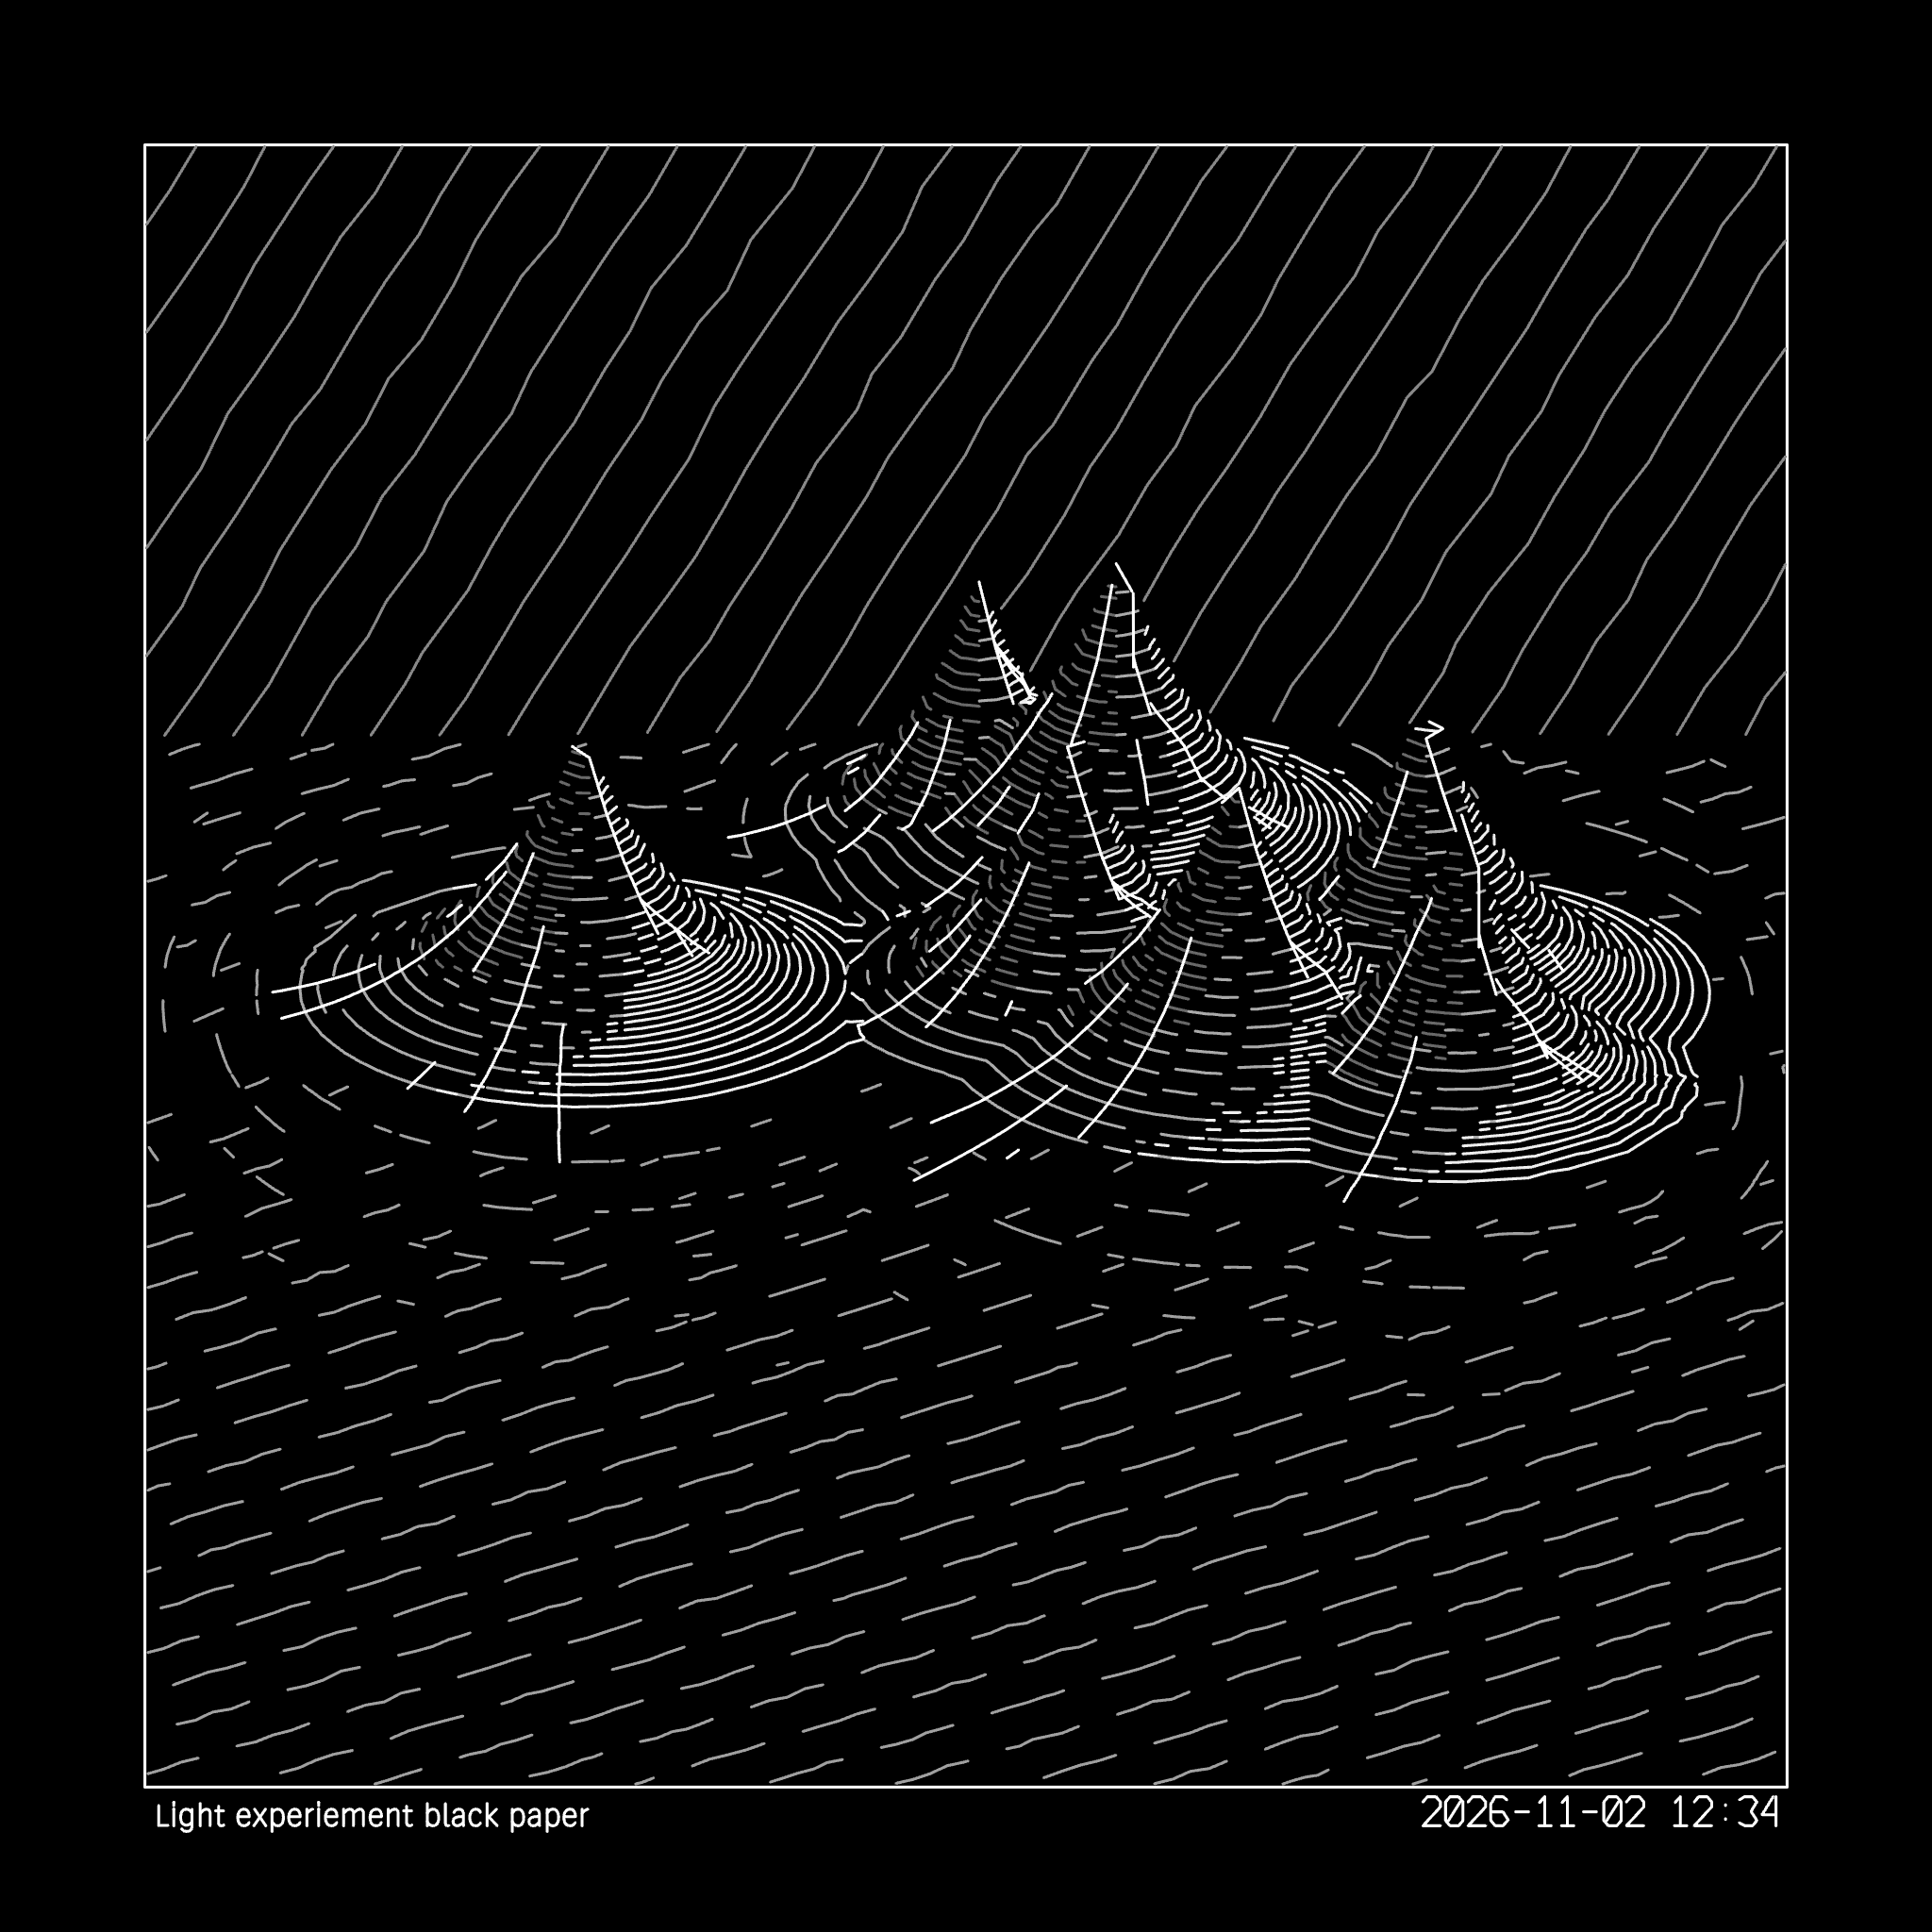
Retrospective journal · October 30–November 1, 2026
The terrain drawings I had been developing in Computational Design Workbench began with imagined landscapes. I wanted to see what would happen when the same plotting approach encountered a real place: a particular mountain with a shape that could be recognized from more than one direction.
I chose Lawetlat’la, also known as Mount St. Helens. The name Lawetlat’la is associated with a place of cultural significance to the Cowlitz Indian Tribe and the Confederated Tribes and Bands of the Yakama Nation. The U.S. Geological Survey notes that the mountain is recognized as a Traditional Cultural Property. A drawing can represent its contours; it cannot encompass the many relationships and histories held in the place.
From elevation to lines
A digital elevation model describes the height of a surface at many points. It is a starting point, not a finished drawing. The decisions that follow include the area to show, the resolution of the surface, the direction of the view, and how the terrain becomes marks a pen can follow.
The elevation source I downloaded was a substantial TIFF file. That immediately raised a practical question: how much detail could be useful in a drawing, and how much would simply increase processing and plot time? The aim was not to reproduce every point from a scientific dataset on paper. It was to find enough information to give the mountain a convincing shape while keeping the lines legible.
The USGS 2017 airborne-lidar elevation dataset offers a detailed view of the ground surface. Its one-meter source resolution is much finer than a small pen drawing can necessarily use. Working at a coarser sampling can make exploration practical, but it also changes which small features survive. The source data and the finished drawing should not be mistaken for the same thing.
A postcard, then a circle of views
One early study, a postcard-sized view labeled N330, plotted nicely. That was encouraging, and it raised another question: would a finer pen let me carry more linear information without the marks becoming crowded?
I also wanted to see the formation from all sides. Twenty-four views, each separated by 15 degrees, offered a way to make a complete rotation visible on a single sheet. Each view became a small drawing in its own right, while the grid made it possible to compare the changing relationships among crater, ridges, and surrounding ground.
The 24-up Lawetlat’la sheet plotted well through Inkscape. A subsequent Next31 test put a 24-view sheet on paper from CDW’s newer layout workflow. The small angle labels were readable with a 0.7-millimeter gel roller pen, although I would consider them small. These were physical tests of particular drawings and settings, not a guarantee that every file or pen will behave the same way.
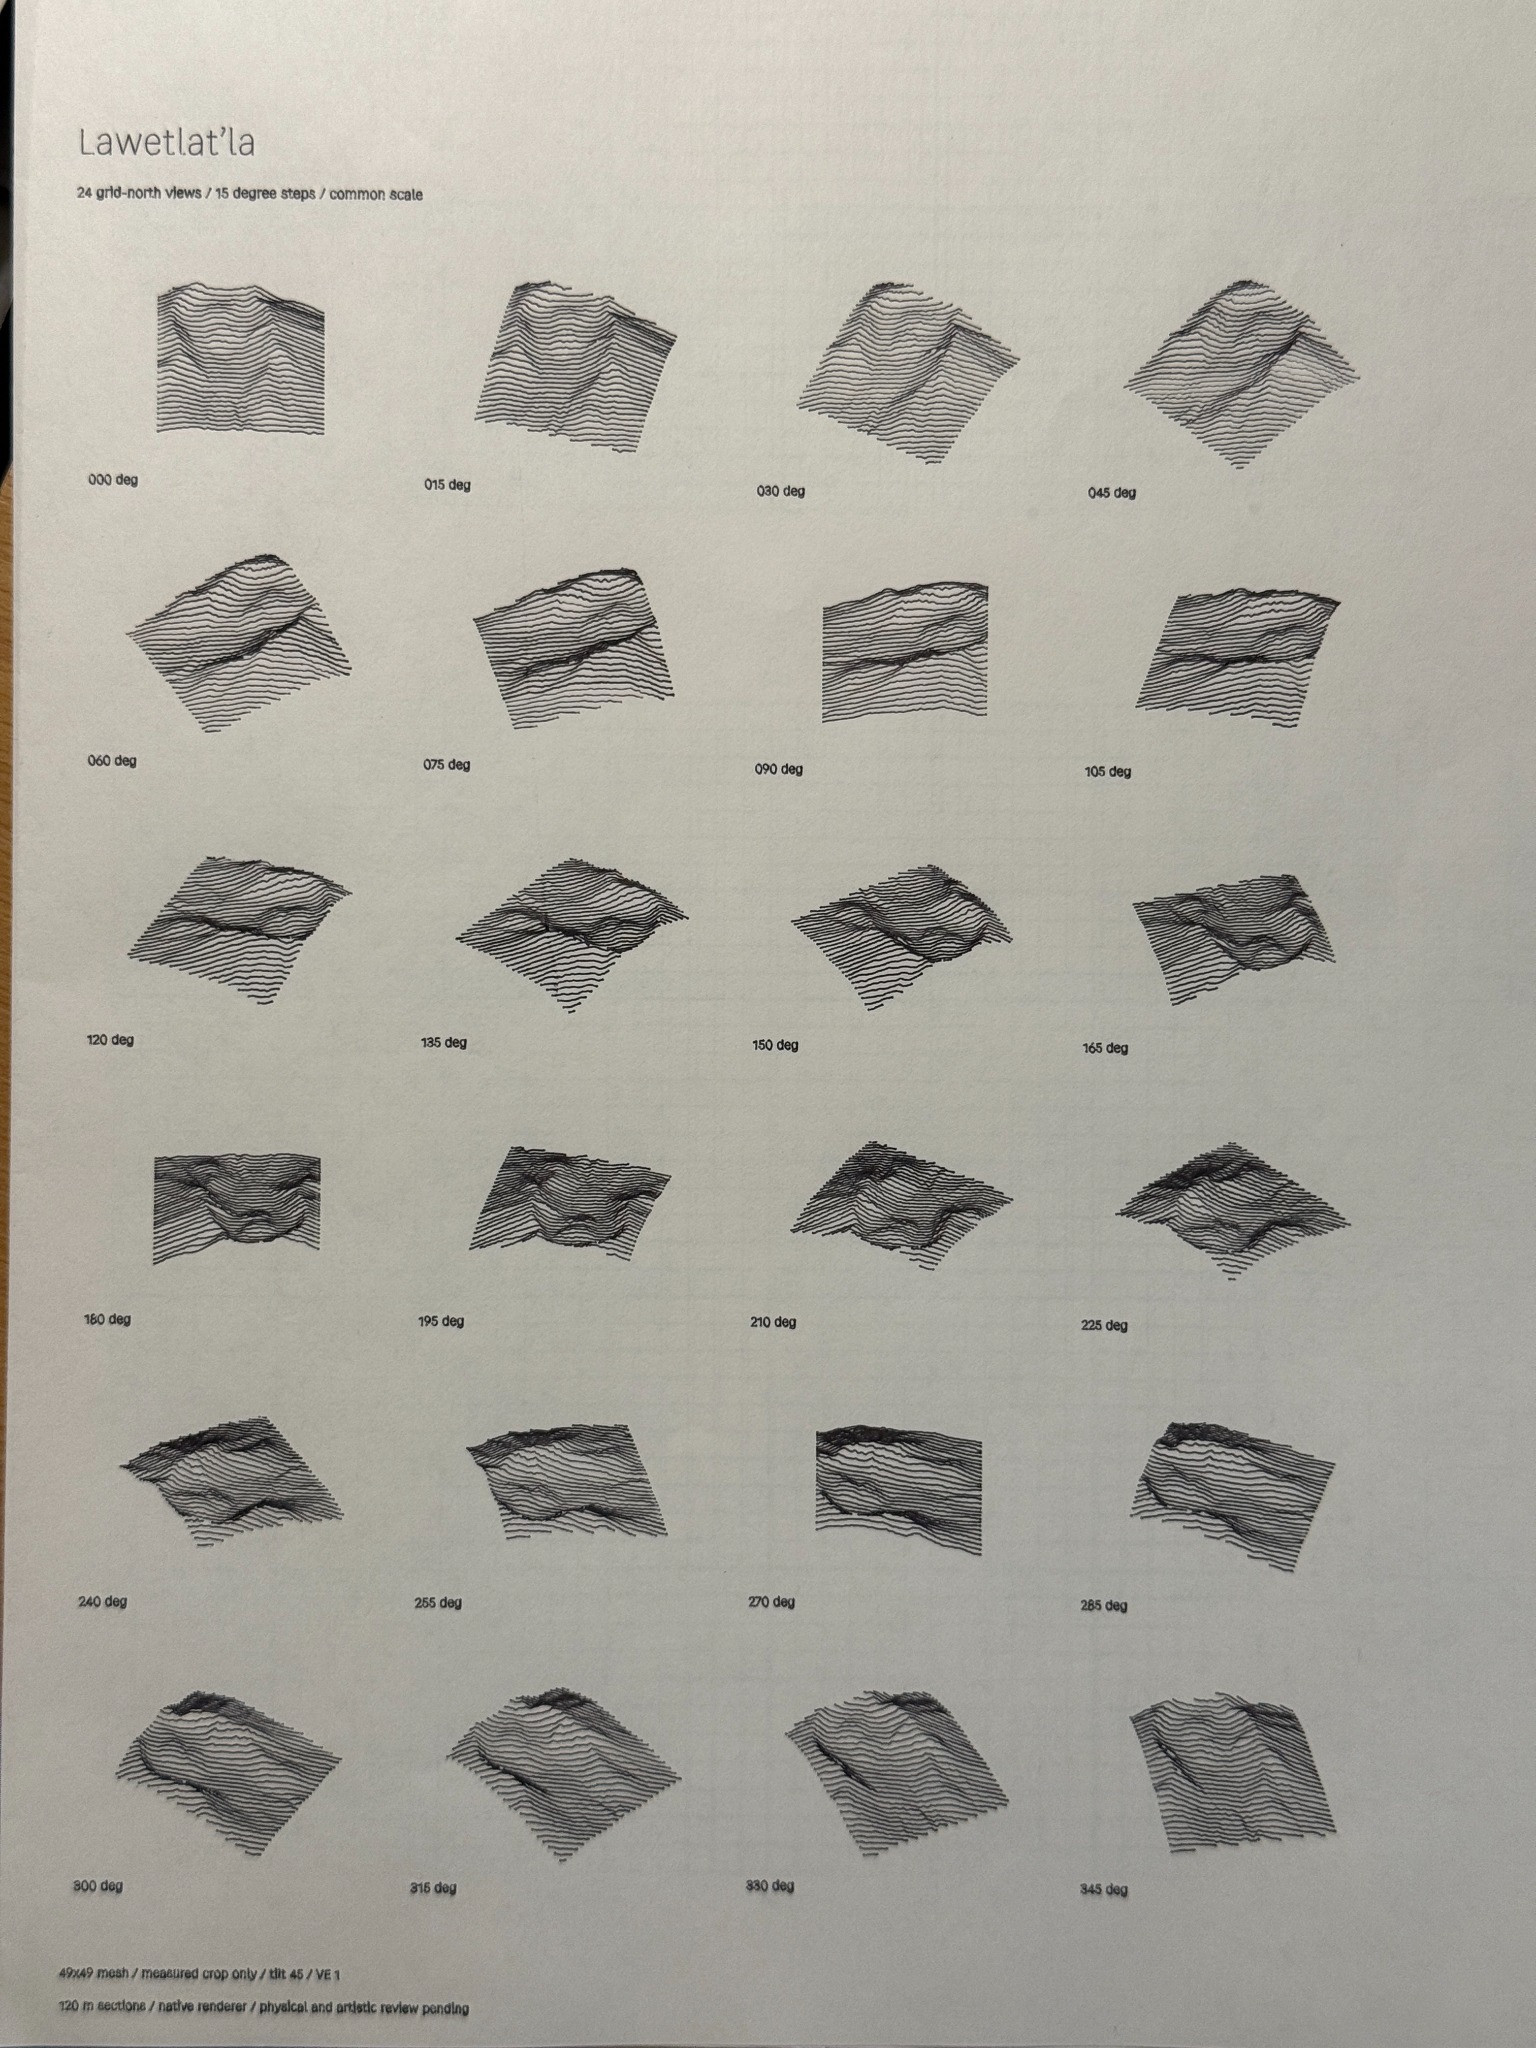
Lawetlat’la in 24 views, arranged at 15-degree intervals.
Getting the drawing onto the card
The artwork could look right in preview and still miss the paper. One postcard plot came out too far down and to the right, clipping the title. The cards measured 100 by 152 millimeters, not precisely the dimensions of a nominal four-by-six-inch sheet. Paper placement and the plotter’s origin mattered too.
I tested a 3D-printed registration jig and plotted a new set of marks over an earlier pass. The results were close enough for my purposes: I was comfortable with a half-millimeter to one-millimeter difference, while noting that the cards themselves might vary. It was a useful reminder that a drawing system includes paper, pen, fixtures, and measurement as well as code.
Where the study goes next
I would like to bring the rotation studies into a small hand-bound look book, with a plotted cover and groups of views folded and stitched together. That idea is still a future prototype. Binding, image margins, paper choice, and how much detail a fine nib can hold all need physical tests.
For now, Lawetlat’la has given the work a valuable reference: a real formation to revisit as CDW’s terrain tools develop, and a set of drawings that connect digital elevation to the decisions made at the plotter.