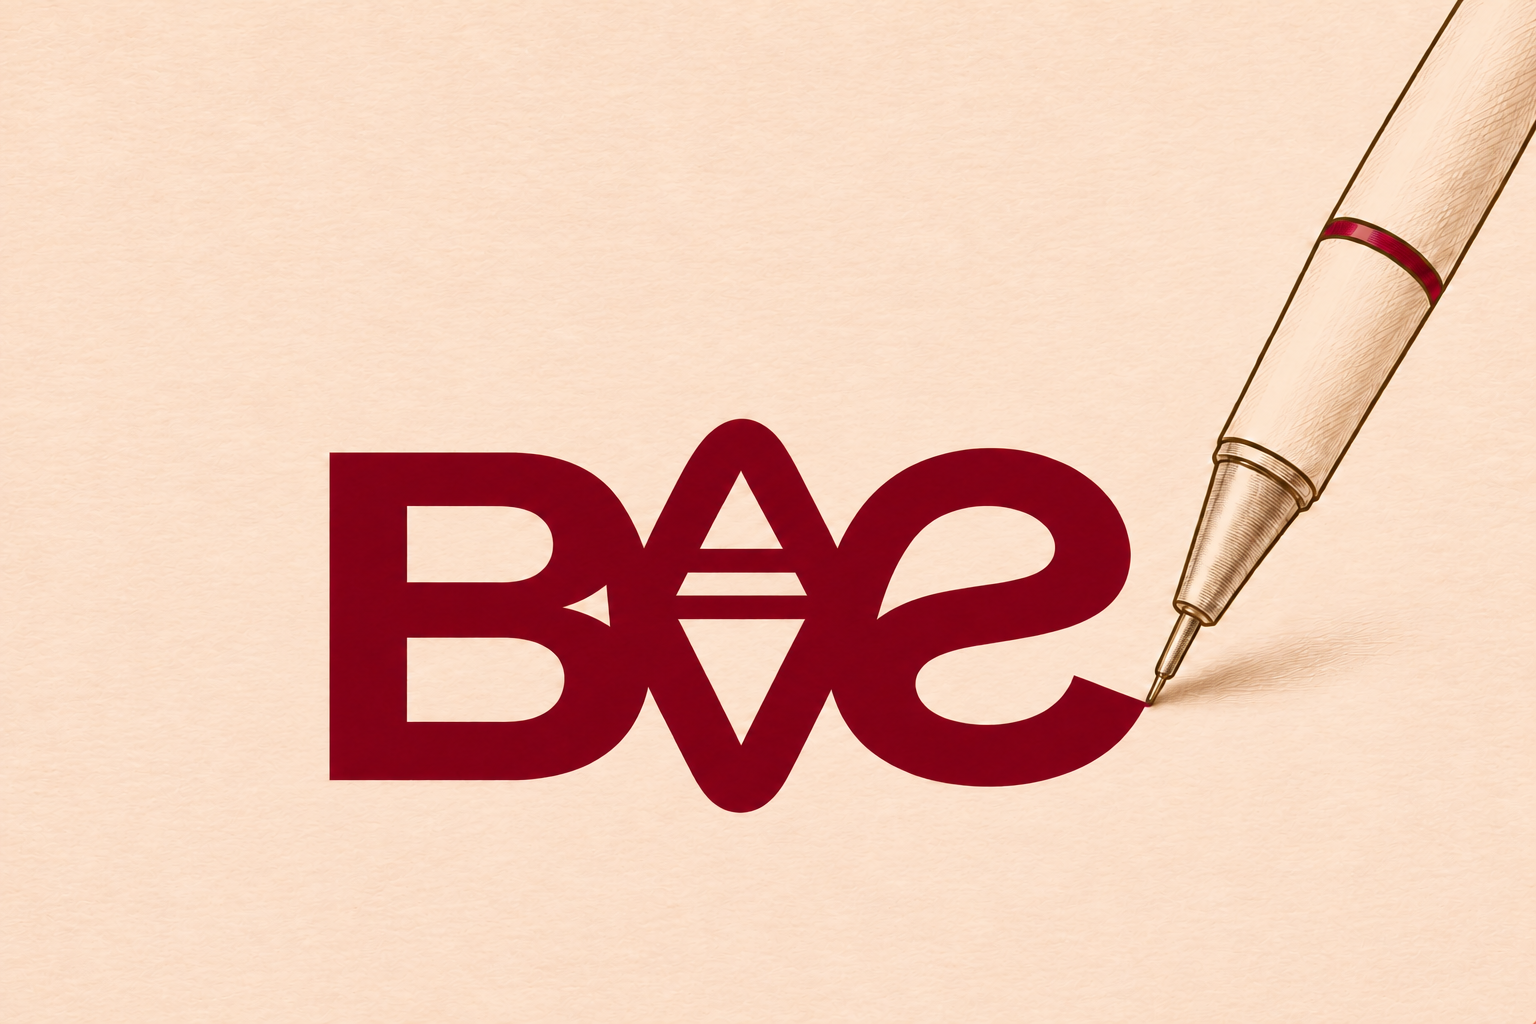
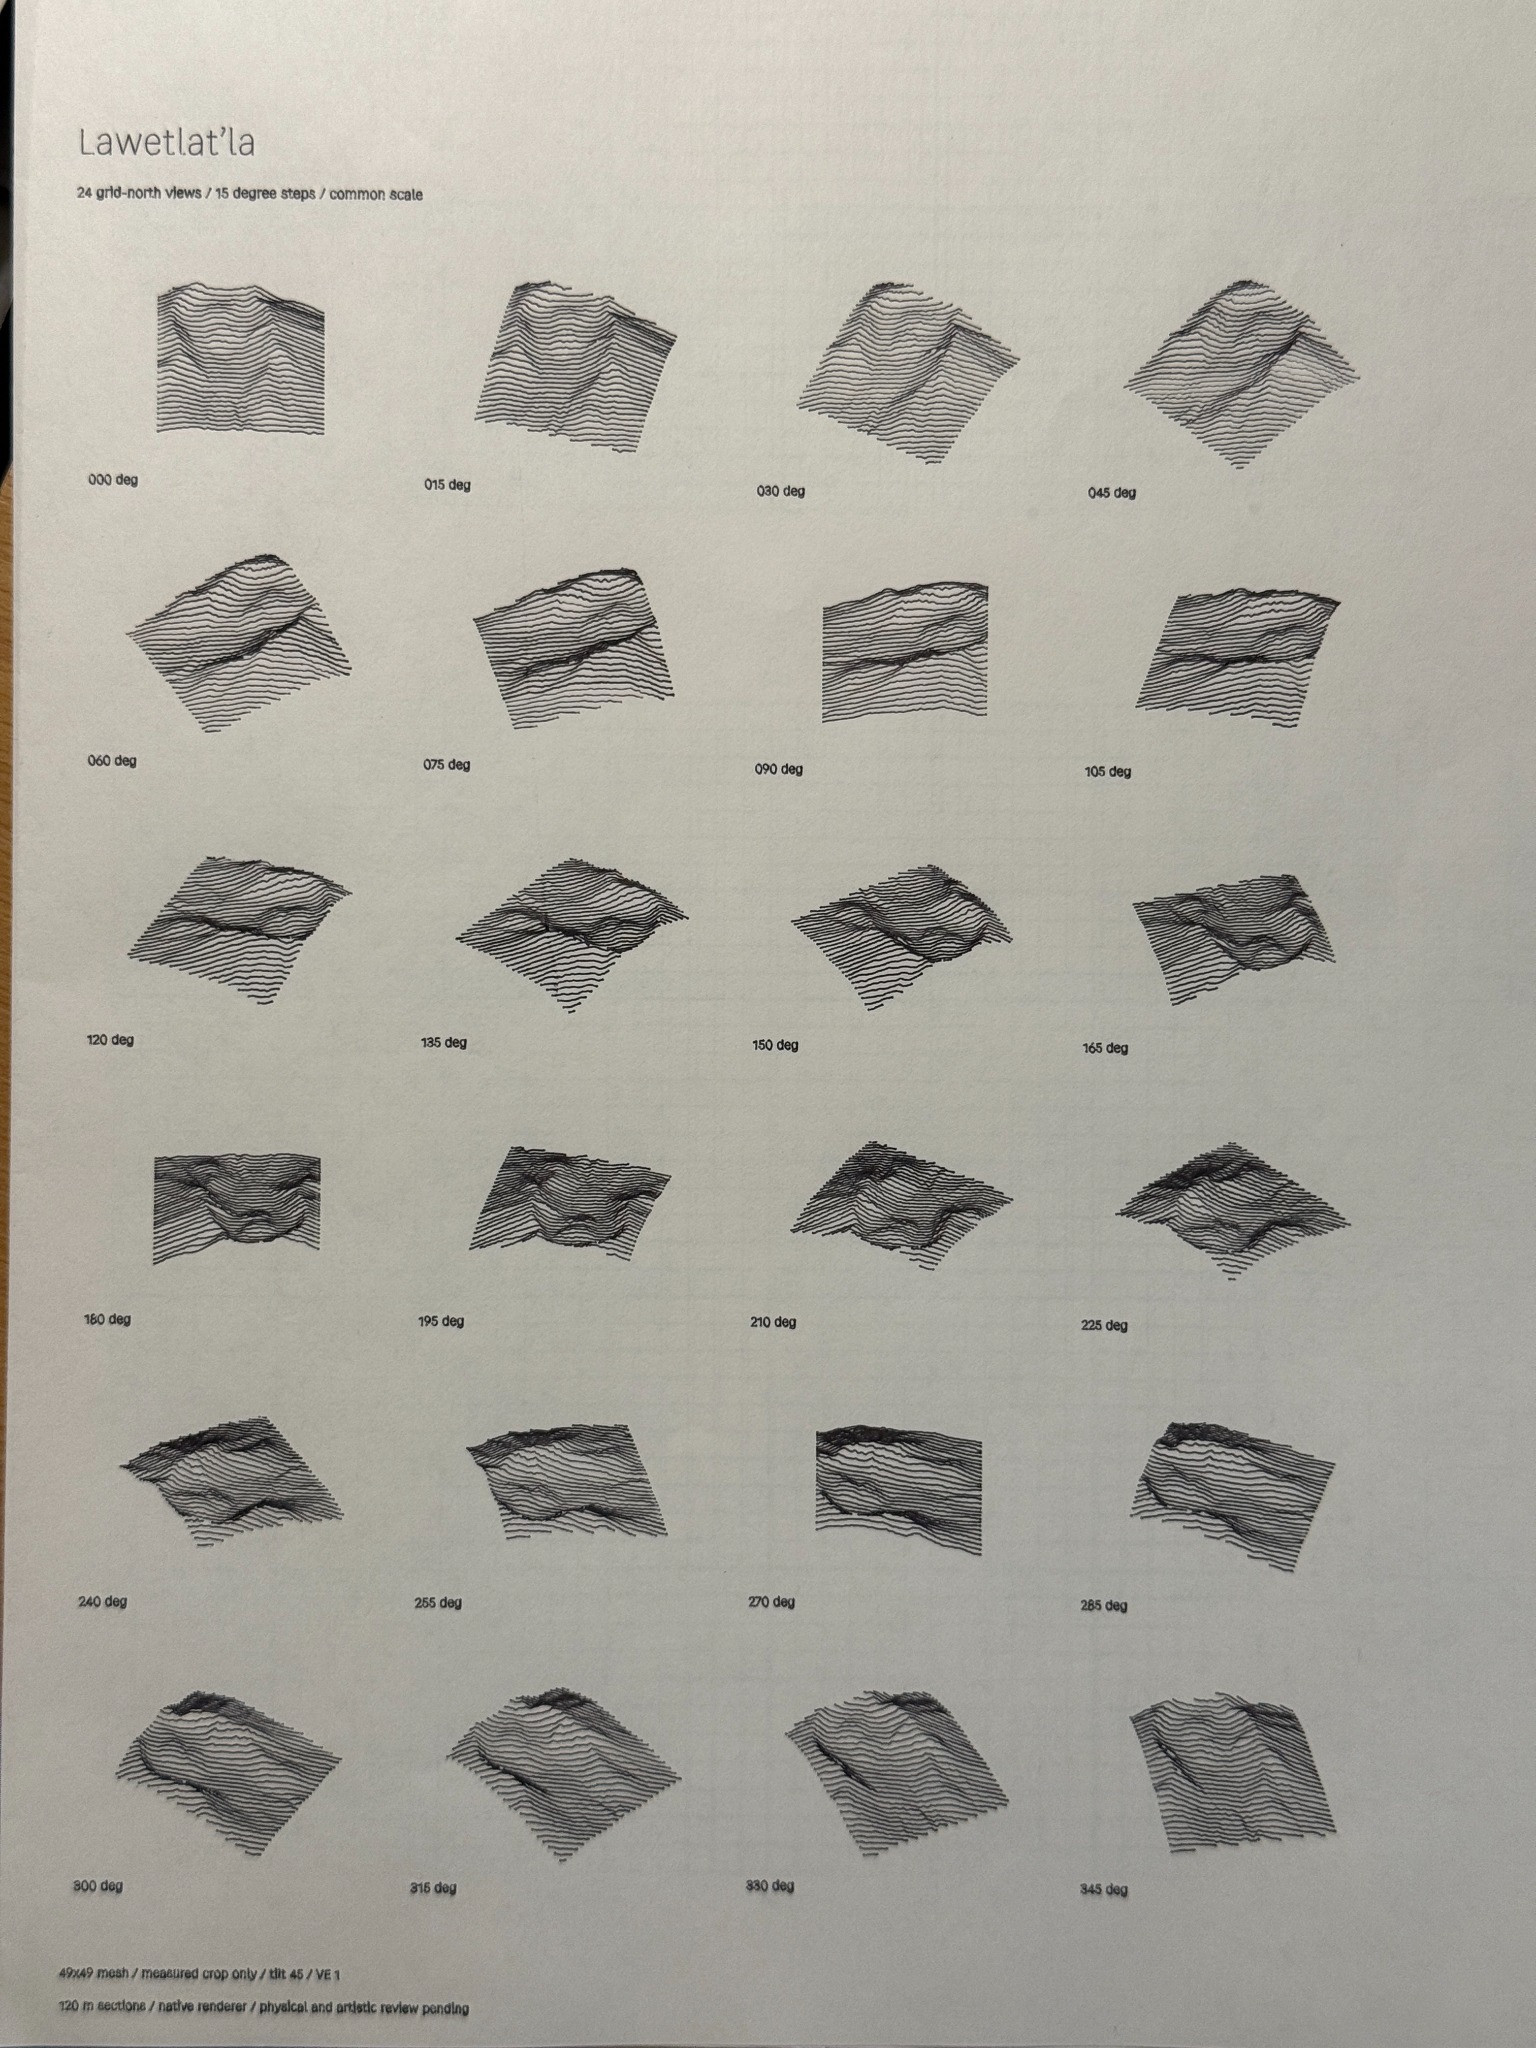
Plotropolis turns an isometric city into a drawing built from paths. Its controls connect the arrangement of a city with the marks used to describe it. This first look covers a browser and SVG export trial of version 1.01. A physical plot is still needed to judge the result on paper.
Created by Matty at Rare Dimension Studio, Plotropolis is free and works without an account. The creator, u/BelvedereFrothingham, introduced it on r/PlotterArt and says generation runs locally, without uploads.
Finding room in the city
Density, building height, city blocks, foliage and waterfront controls shape the larger composition. View and lighting affect how the forms read, while hatch spacing changes their texture. The useful question is how much detail a drawing needs. Roads and open water give the denser blocks room to read.
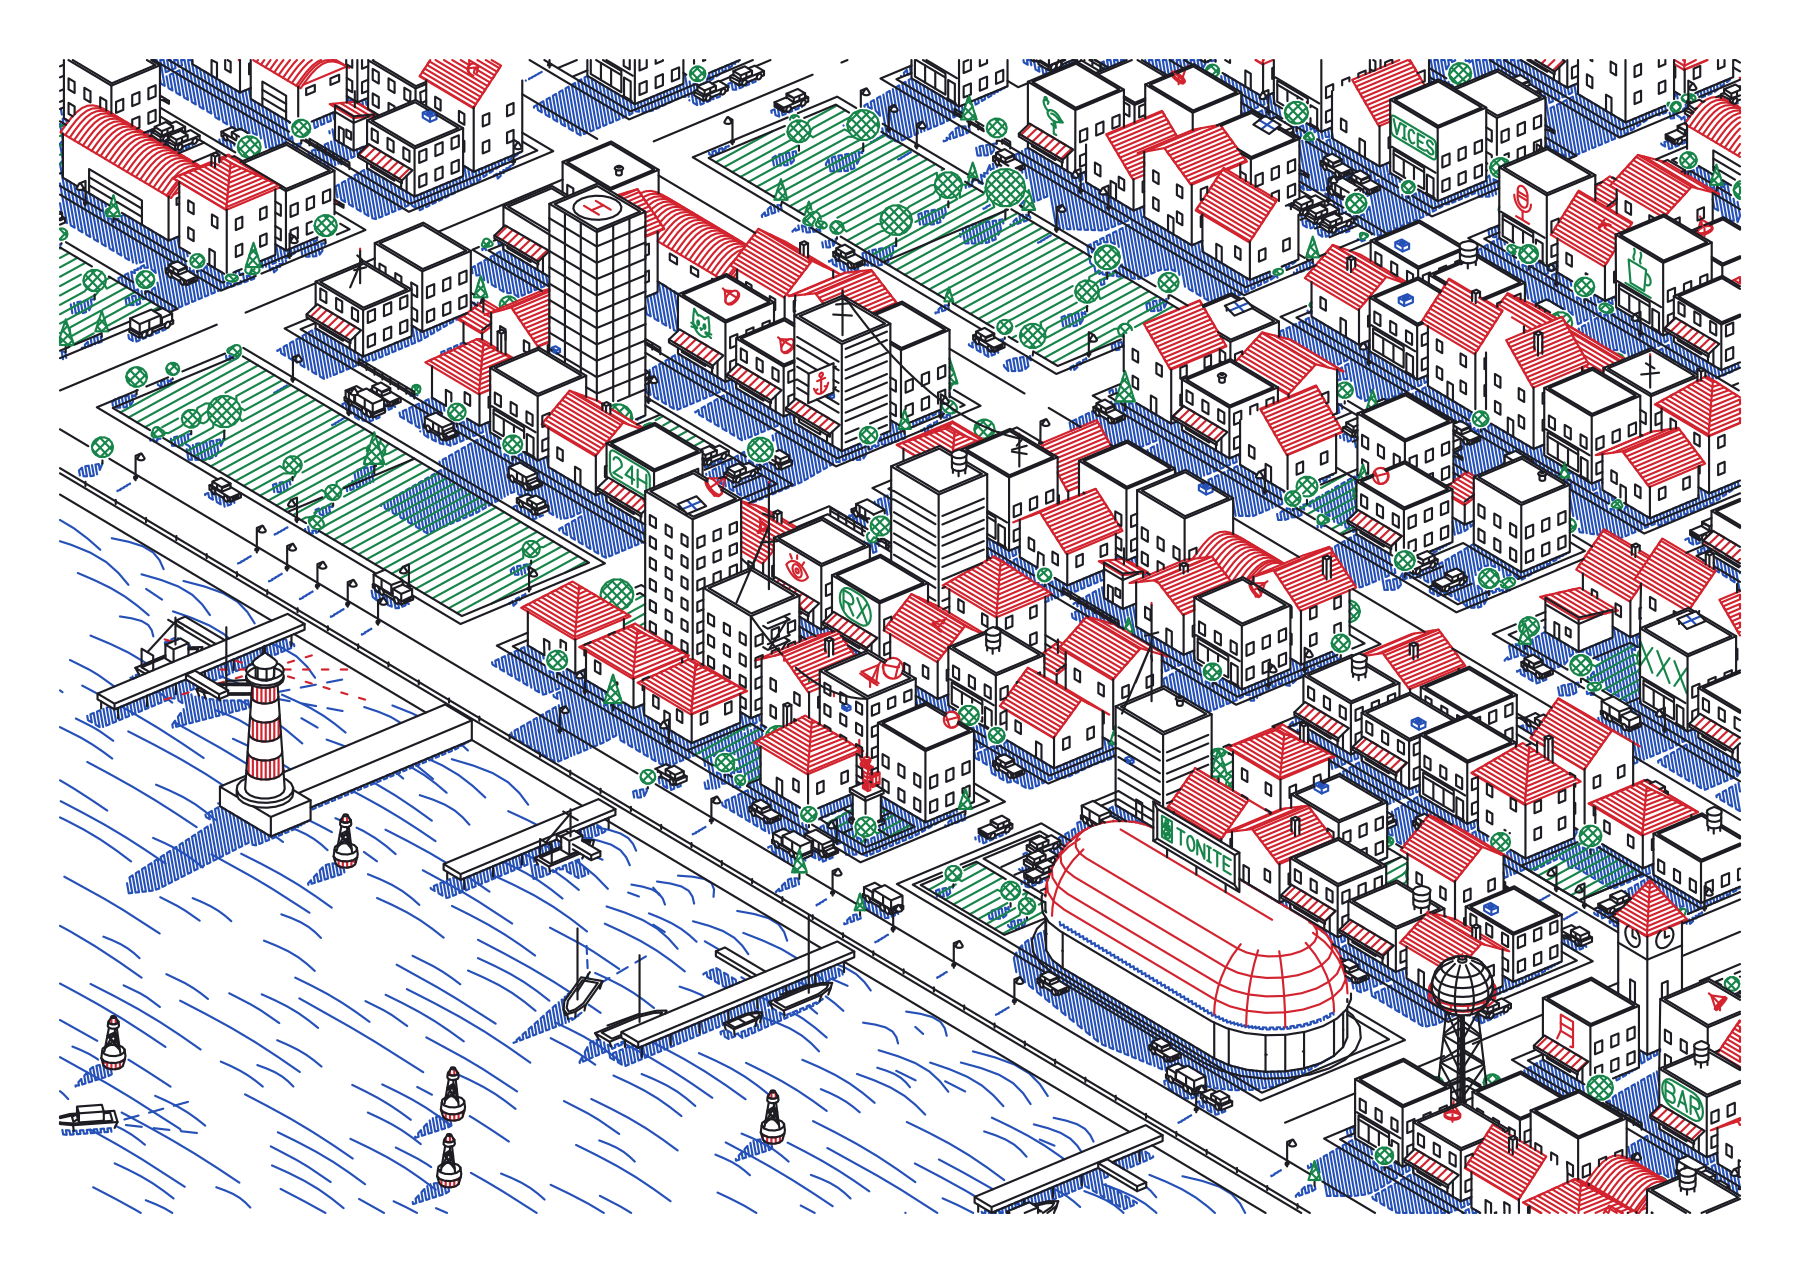
The 12-variation contact sheet worked in the trial, making it easy to compare arrangements before choosing seed 1914. Its waterfront opens the lower part of the drawing, while taller buildings interrupt the repeated rhythm of roofs and windows.
Reading the exported paths
Four pen slots can be assigned to roles such as roofs, shadows, trees and linework. In the seed 1914 color export, 4,514 paths were divided among four SVG layers. Switching to “All one pen” changed the preview and produced a single black layer with 4,193 paths. The monochrome version makes the balance of line density and open space easier to inspect.
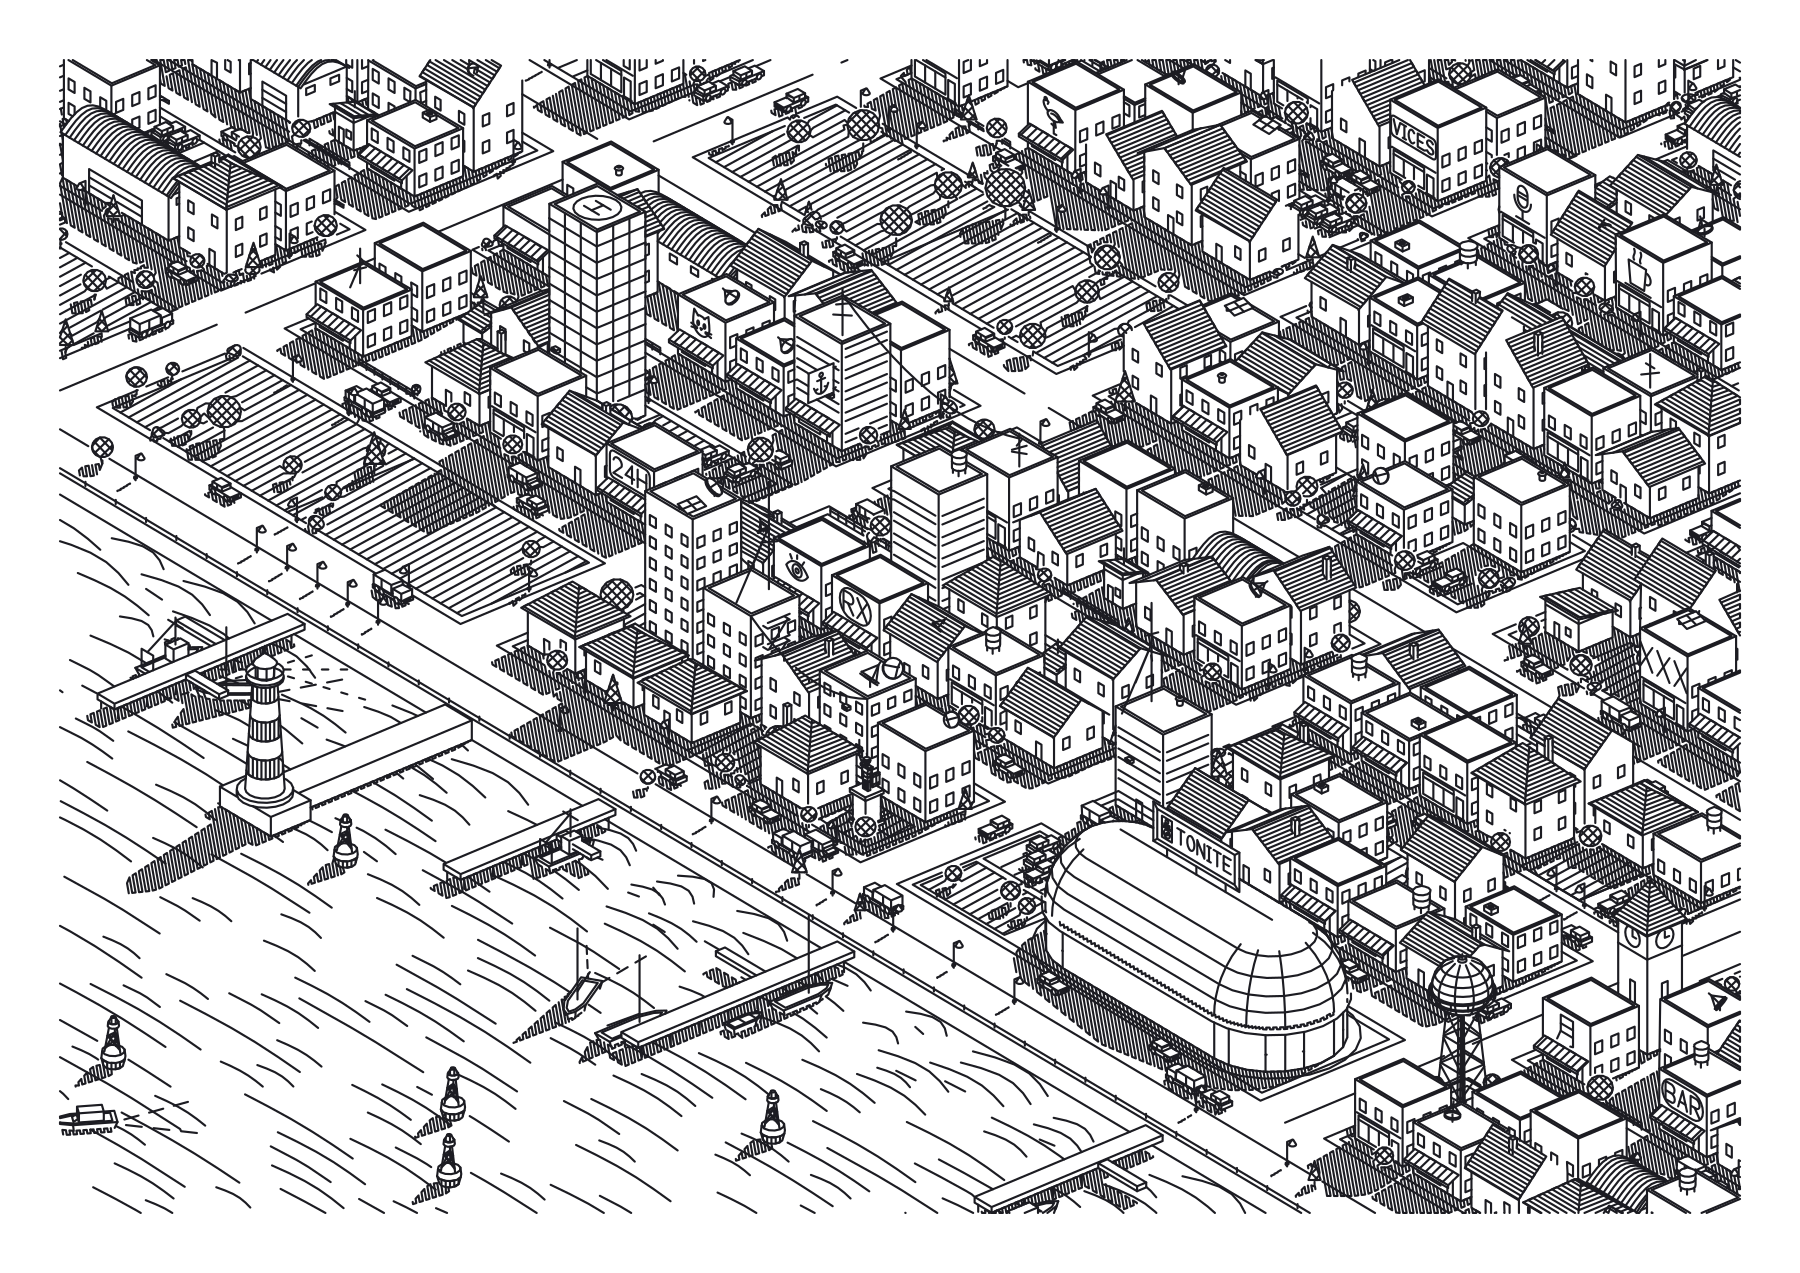
One caution appeared in that session: the statistics panel kept the earlier four-color breakdown after the switch, although the exported SVG contained one black layer. Pen assignments therefore deserve a check in the file itself. The initial seed 1908 design also carried an estimated plotting time of 1 hour 7 minutes at 40 mm/s. That is an app estimate, not a measured run.
The exports specify A3 landscape at 420 × 297 mm. Settings can also be saved as JSON, and the saved color settings recorded seed 1914. These files provide a useful starting point for further testing, though neither an Inkscape import nor a physical plot has been checked.
A sensible next step is a sparse, one-pen drawing at its intended physical size. Check the small windows and hatch spacing, then compare the color version for registration and legibility. Plotropolis is most interesting here as a way to study how a city holds together as a drawing before committing to a full A3 plot.